

Inside Arbitrum DRIP Season 1

“You get what you incentivise.”
In Decentralised Finance (DeFi), incentives play an important role in shaping a project’s growth trajectory, but they often come with a double-edged sword: once these incentives are removed, users may leave the platform to seek similar opportunities elsewhere.
The challenges behind DeFi incentives can be classified under:
Focusing on multiple protocols simultaneously dilutes incentives. (This is for ecosystems)
Not assigning weightage to KPI-driven performance based on tracking key metrics.
Lack of Flexibility in incentive distribution and the ability to dynamically change incentives during the course of the program.
Lack of tapered rewards to smoothly exit an incentive campaign.
Bad User Experience for distribution.
These five challenges encapsulate the state of incentives in DeFi and why they might fail. Typically, protocols and ecosystems adopt a “Spray-and-Pray” approach, deploying capital to attract users, hoping they will remain engaged, without any proper structure.
Ecosystems such as Arbitrum recognised these problems and addressed them by launching the DeFi Renaissance Incentive Program (DRIP), which is funded by the DAO and designed by Entropy, aiming to reward targeted actions and conduct KPI-based distributions, so that the protocols performing best were rewarded the most.
This report examines the program’s performance and its contribution to ecosystem growth, as well as the incentivised protocols and assets.
DRIP: A KPI driven Incentive Program
The DRIP program was introduced based on lessons from previous incentive programs run by Arbitrum DAO, such as STIP (50 million ARB) and LTIPP (45 million ARB), iterating on their impacts and shortcomings. The problems of these programs were similar to those mentioned above, particularly regarding the incentive structure (mostly fixed) and mercenary capital. While these incentives led to a brief spike in activity, this effect did not sustain over the long term, necessitating changes to the approach.
Contrary to previous spray-and-pray incentive programs, DRIP was a highly precise, targeted program that focused on key assets and winning protocols. The DRIP program is distributed across 4 seasons, allocating a total of 80 million ARB tokens. Each season has a singular, clear objective, for example: making Arbitrum the best place to borrow USDT against wstETH, or achieving the deepest liquidity for a particular trading pair. By focusing on one vertical at a time, the program can more easily measure outcomes and iterate on findings.
The first season officially concluded on 17th February, 2026, after running from September 3rd, 2025. This season had a budget of 24 million ARB (including 8 million ARB discretionary budget) and focused on lending and borrowing of yield-bearing ETH and stable assets across blue-chip lending protocols such as Aave, Morpho, Fluid, Euler, Dolomite, and Silo.
DRIP Season 1 had 24 epochs (1 epoch = 2 weeks), where each epoch had a particular role:
2 Discovery epochs: Market Exploration phase to determine which protocols perform best with the incentives. These epochs helped determine which protocols perform better with greater incentivisation.
6 Performance epochs: Optimised incentives distribution based on the analysis of the previous epochs. In each of these epochs, the incentives were dynamically allocated based on the protocol’s performance. In some cases, incentives were even paused to align with the market conditions.
4 Taper epochs: Gradual reduction in incentives to ensure TVL/activity retention. The reduced incentive ensures that users aren’t suddenly deprived of incentives, which might lead them to leave the platform.
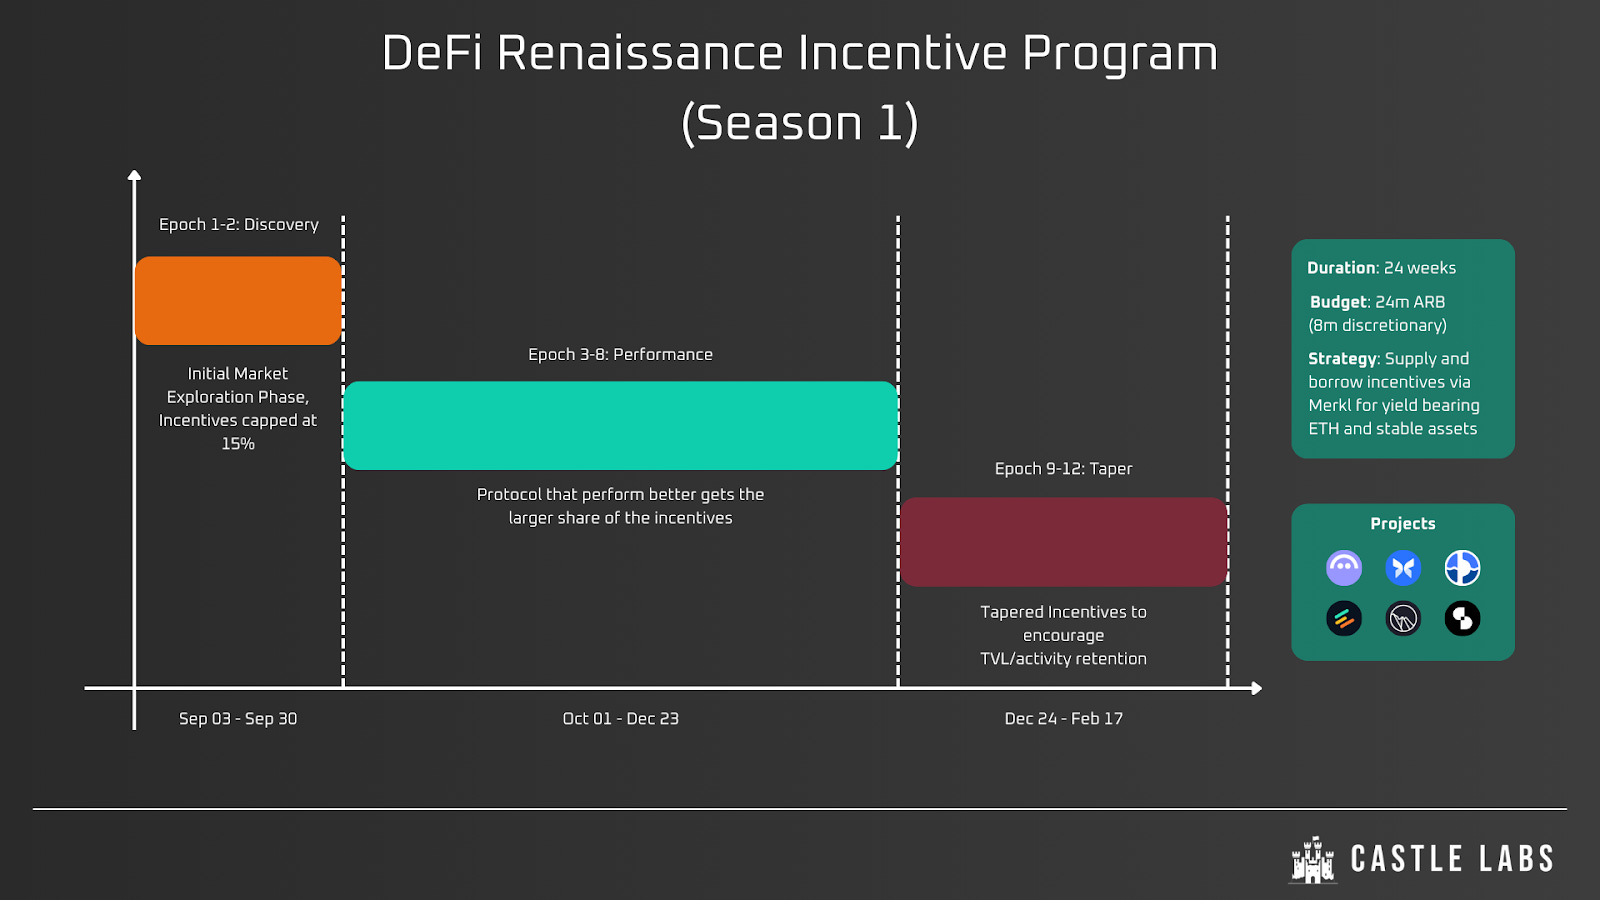
Finally, to ensure the program provides the best user experience for incentive distribution, Arbitrum collaborated with Merkl and launched a website listing all active opportunities.
Season 1 of DRIP has officially concluded, and this article assesses its effectiveness. As noted above, DRIP led to a shift in approach, focusing on looping and yield-bearing assets. A looping strategy is executed as follows:
Deposit a yield-bearing asset on the eligible protocol
Borrow stables like USDC
Buy more of the yield-bearing asset from step one.
Repeat the process to achieve maximum leverage and yield (yield from asset - borrowing rate)
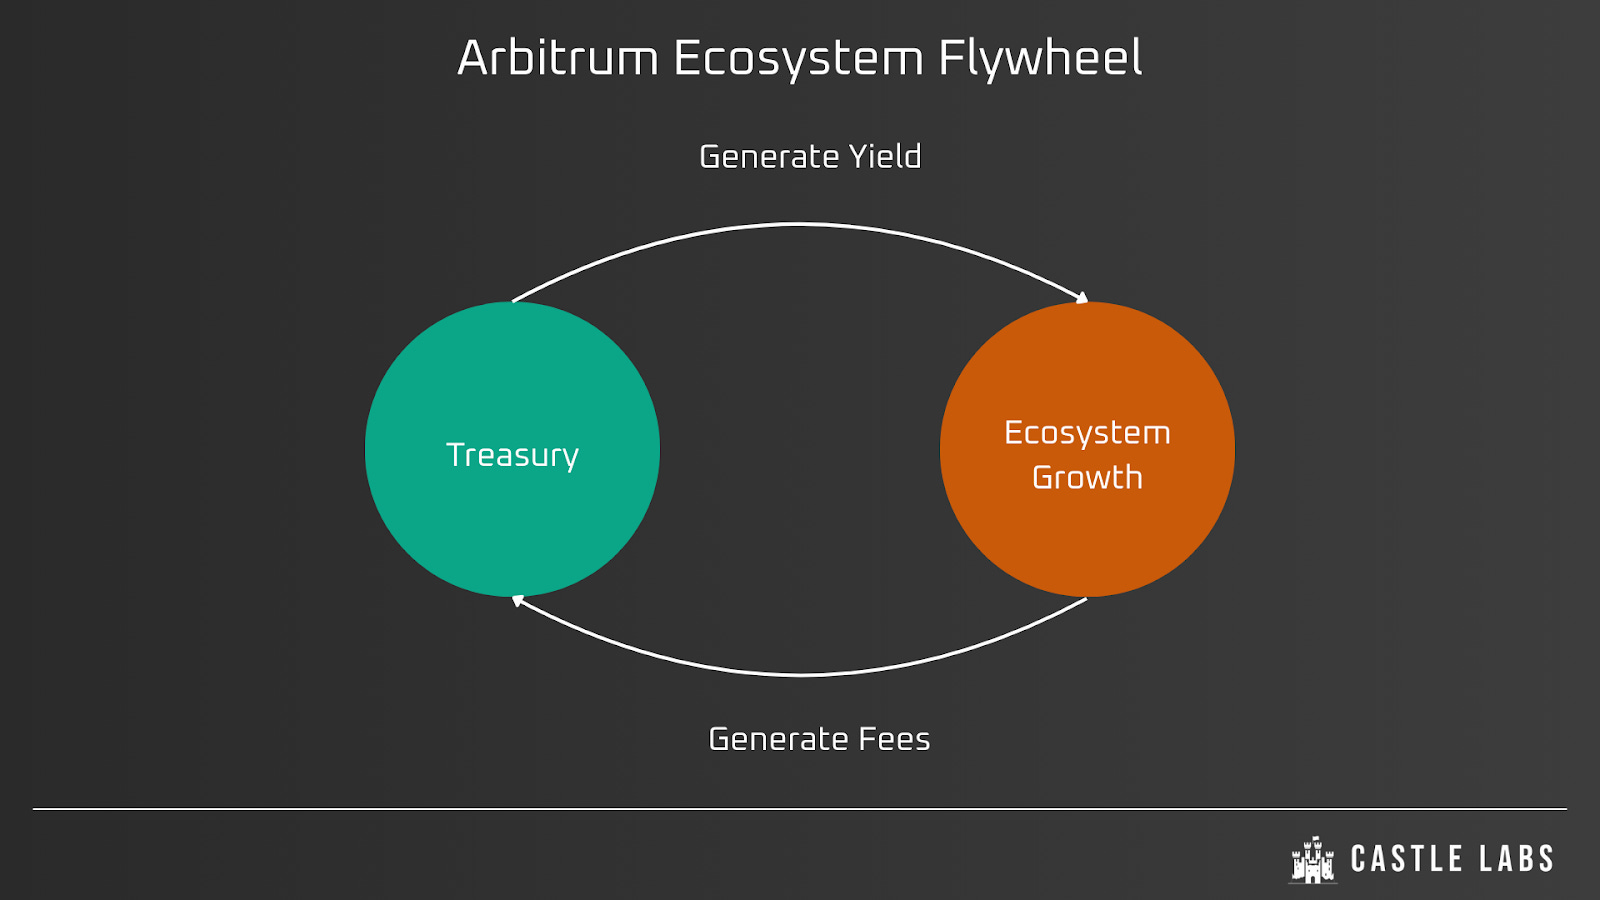
On Ethereum, Looping accounts for most activity in lending protocols, so incentivising it on Arbitrum was a clear choice. Moreover, it also has second-order effects that create a flywheel in which incentives increase user yield, thereby attracting more capital and prompting users to swap their assets as the process of looping increases DEX activity and liquidity.
While we now understand how DRIP addressed issues surrounding incentive structuring, this section highlights the campaign’s impact. But before we move on to that, let’s understand some of the KPIs to access DRIP:
Cost-effectiveness: It is a measure of the net change in protocol/assets growth on Arbitrum relative to the provided incentives. This value determines whether the incentives led to any growth.
Market Size and Borrowed Liquidity Growth: Net change in Arbitrum market size and borrowed liquidity.
Market Share and Comparative Metrics: Arbitrum growth compared to other L2s like Base.
Network Level Metrics: Growth of Arbitrum Total Value Locked (TVL), Total Value Secured (TVS), DEX Liquidity, and Fees Generated.
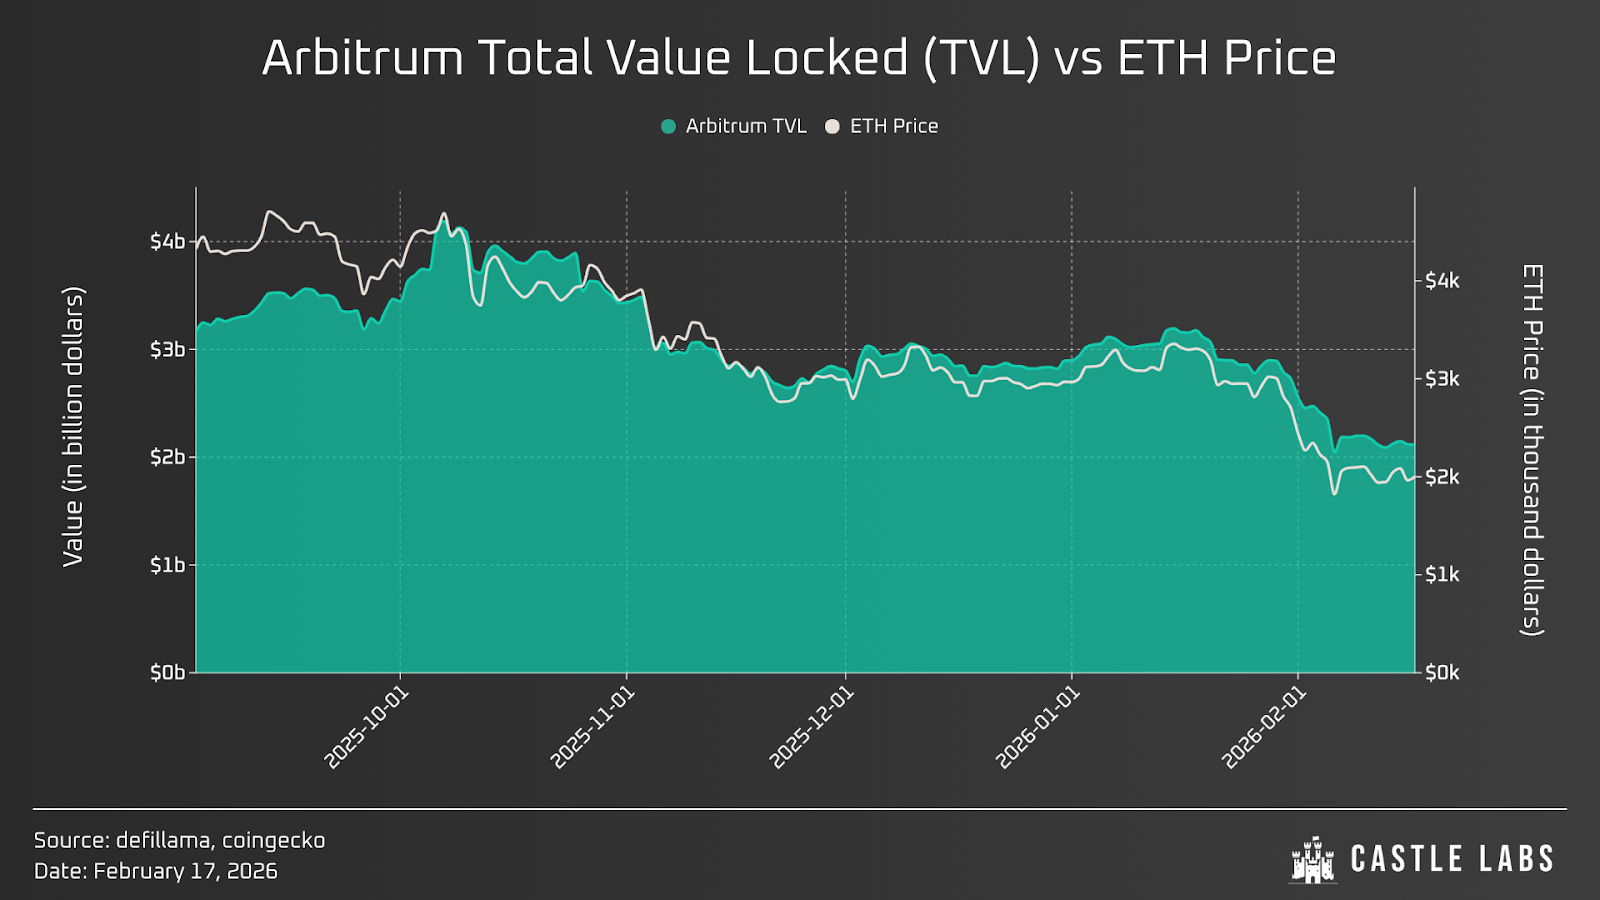
Starting from network-level KPIs, Arbitrum Total Value Secured (TVS) decreased by ~13%, from $13.77 billion to $11.97 billion (excluding Hyperliquid USDC), and Total Value Locked (TVL) decreased by 34%, from $3.17 billion to $2.09 billion, during the DRIP campaign. Compared with competitors over the same period, Base TVL declined by only 17.6%, from $4.75 billion to $3.91 billion, without incentive programs.
However, these plain numbers only provide half of the picture. While the charts show that DRIP did not sustain value, this is attributable to a strong decline in ETH’s price, which is down 60% from its peak in late August and 40% over the last month, as we can see below how strictly correlated Arbitrum TVL is with ETH price. This drawdown in the broader market has reduced DEX liquidity (down 58% from peak in mid-October) and volume on Arbitrum as expected.
On the other hand, the market cap of Yield-bearing stablecoins (YBS) grew compared to Liquid Staking Tokens (LSTs) and Liquid Restaking Tokens (LRTs), which are ETH-related yield-bearing assets that follow its price.
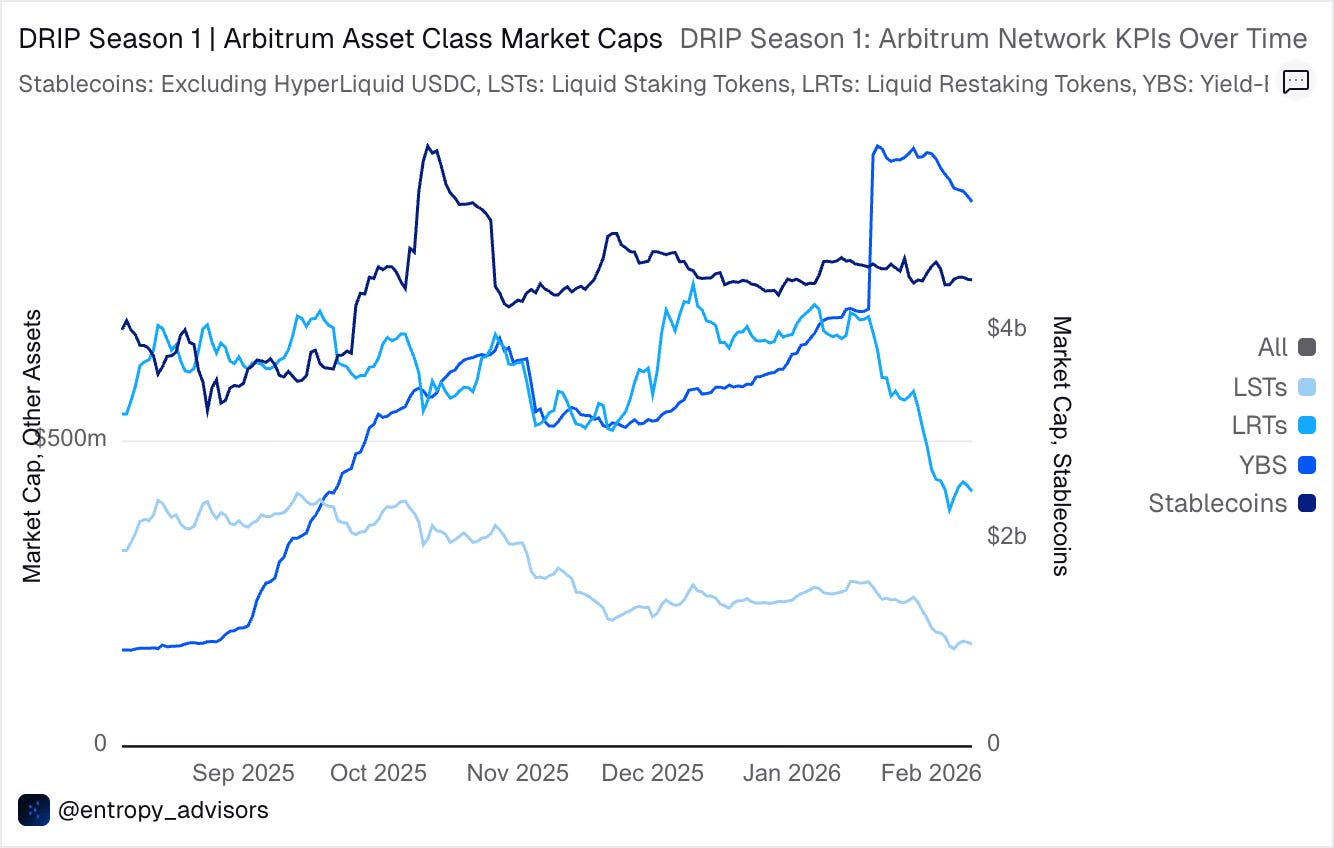
The push from YBS stems from the launch of USDai and sUSDai, as well as other assets such as wstUSR (Resolv), thBILL (theo), sryupUSD (Maple), and sUSDC and sUSDS (Spark), and from their growth on Arbitrum last year. Additionally, greater incentives were provided to YBS due to the ETH’s non-optimal supply to run incentives properly in certain epochs. This constant monitoring of the market conditions helped to use incentives in the most capital-efficient way.
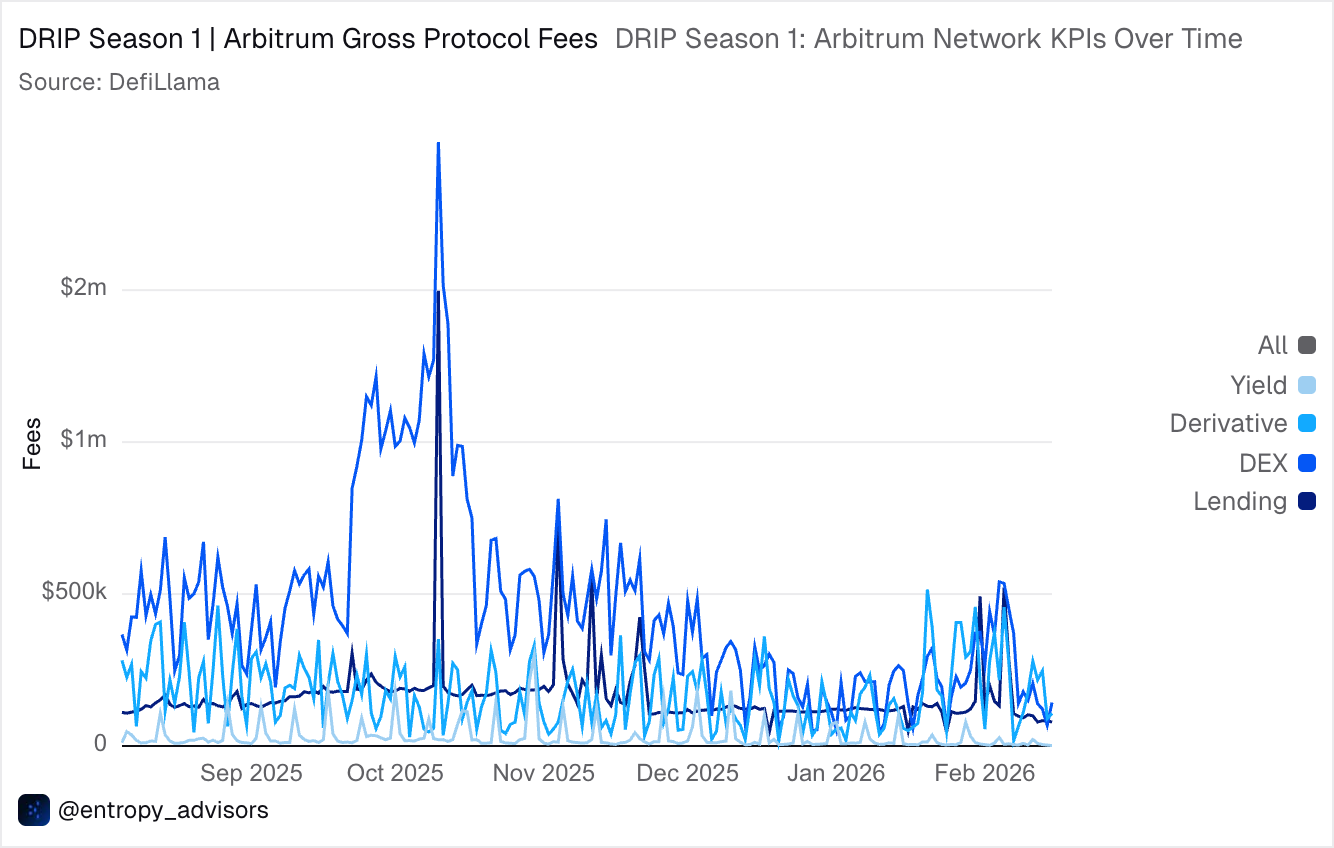
Furthermore, the fees generated by protocols appear to be consistent with the broader market state. It declined over time as asset prices fell. Certain peaks are evident in the chart below, occurring around major market drawdowns, such as the October Liquidation Event and the early February crashes, when users rush to unwind their positions or are liquidated.
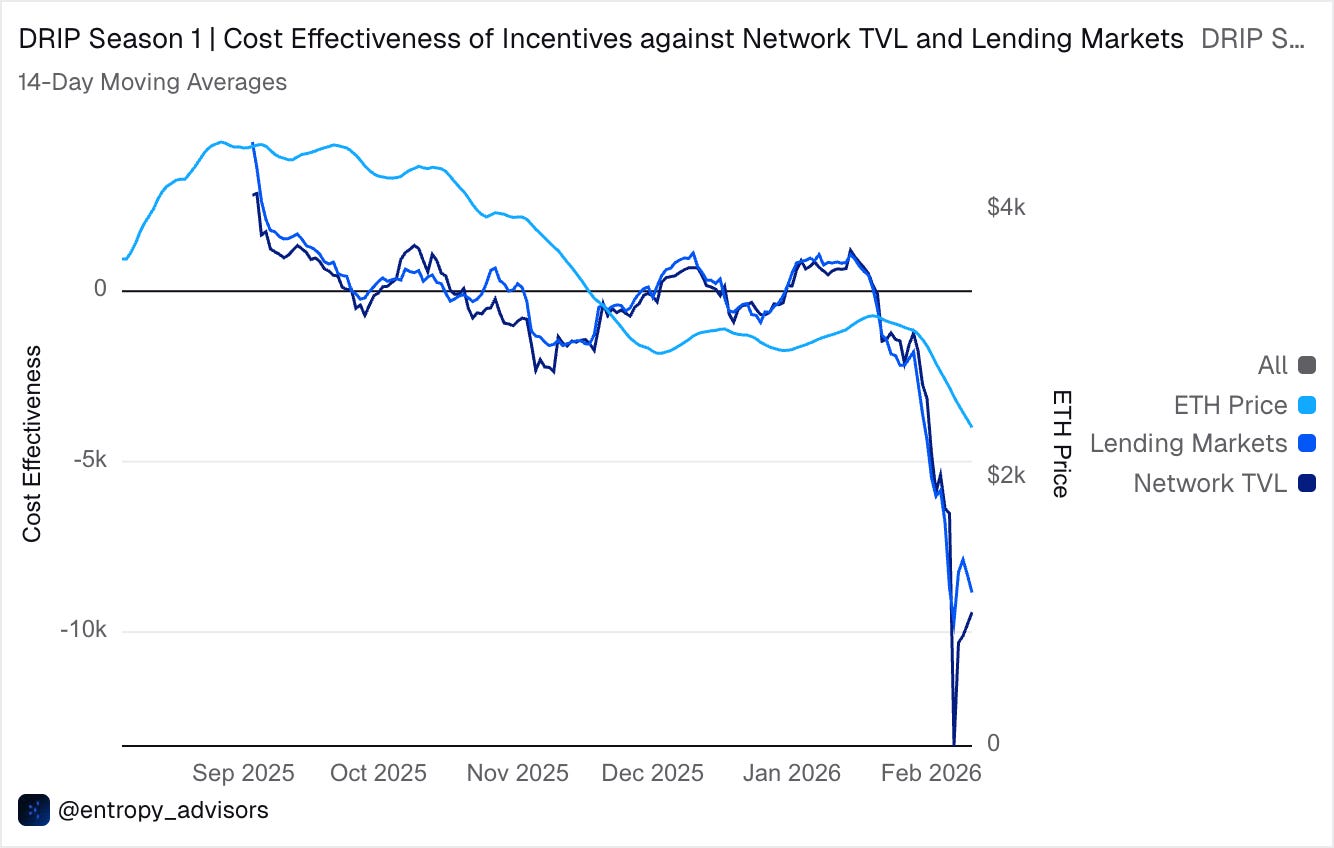
Another relevant metric, as reported in the Entropy dashboard, is the program’s cost-effectiveness. It is calculated by dividing the change in Arbitrum Network/Lending Markets TVL by the daily U.S. dollar average value of allocated ARB incentives. In short, if this value is positive, it indicates that the incentives contributed to an increase in TVL; if it’s negative, it indicates that the incentives didn’t have much impact.
This metric declined slightly after the October Liquidation Event and has recently declined further as ETH prices continue to fall and TVL goes down in dollar terms. Thus, incentives cannot keep pace with the reduction in the ecosystem’s locked value.
The next section dives into incentivised protocols and assets, reviewing their growth.
Lending Protocols
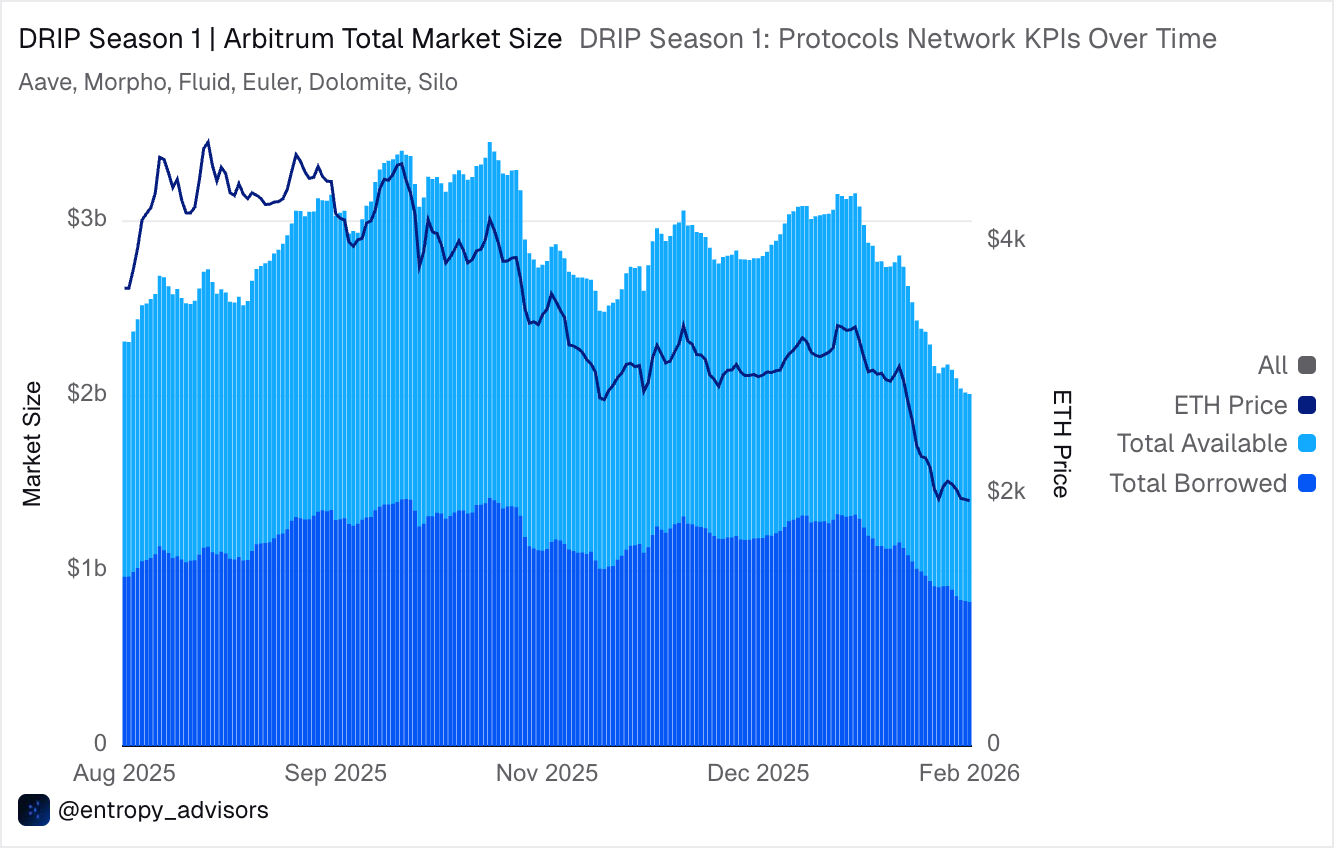
By design, DRIP Season 1 prioritised high-velocity DeFi activities, such as looping, thereby incentivising blue-chip lending protocols. These incentives initially increased the market size of lending protocols, but later declined following the ETH price and broader market drawdown. Currently, the combined market size of the incentivised protocols is down by ~26% from the start of the campaign (i.e., 3rd September 2025), from $2.66 billion to $1.97 billion.
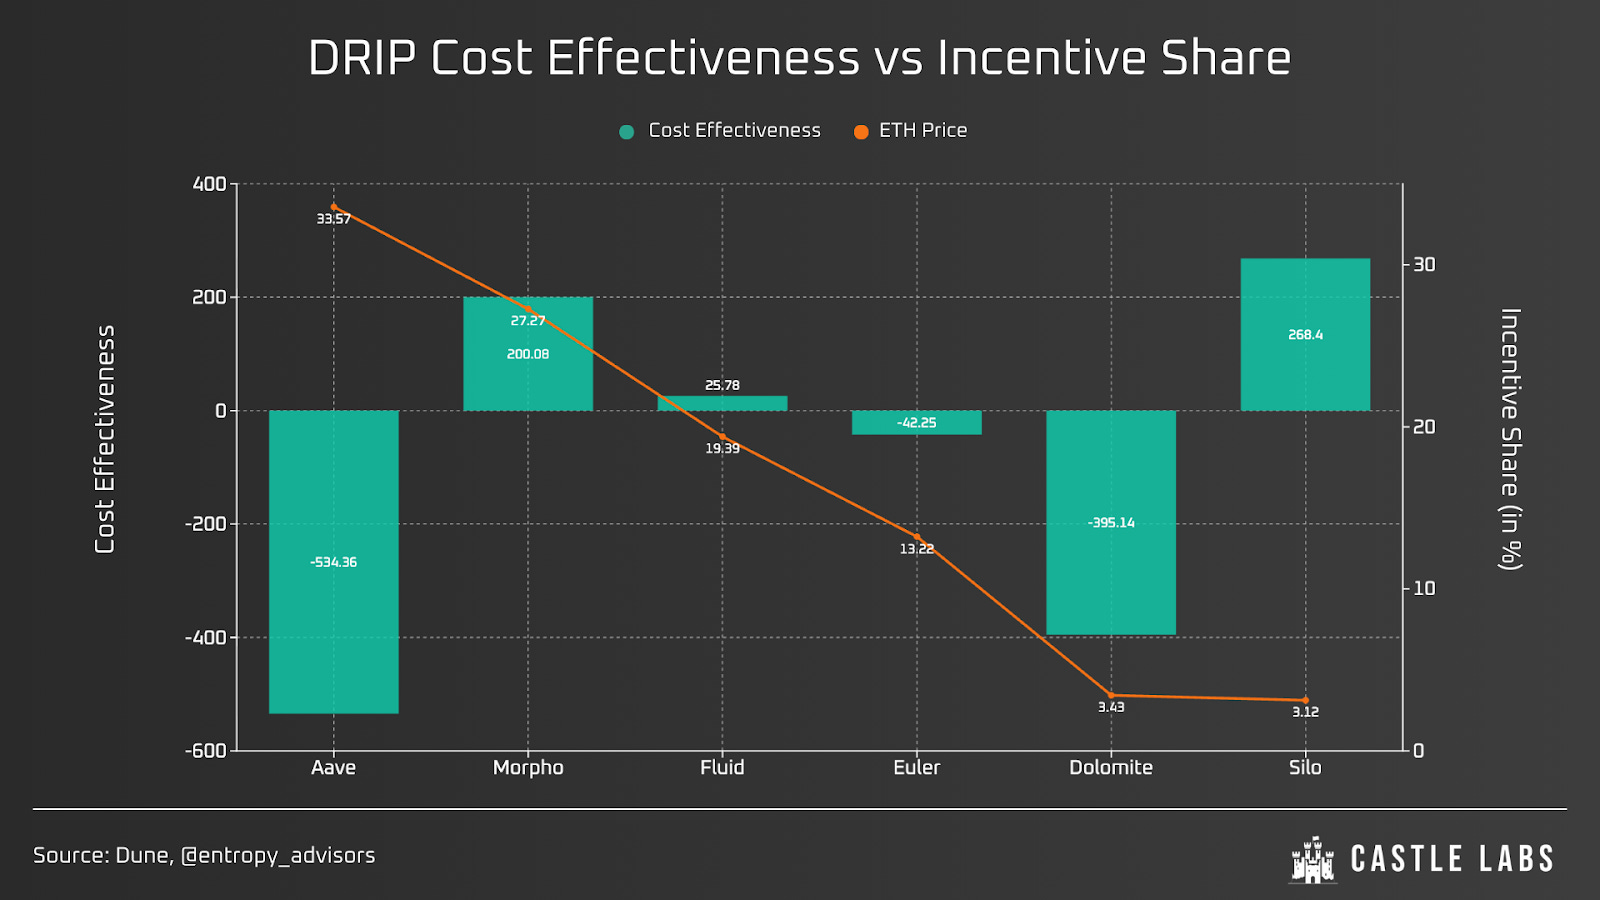
Reflecting on the program’s cost-effectiveness, only three of six protocols had a positive impact, owing to factors such as protocol asset concentration and market drawdowns. Cost-effectiveness is calculated as the change in the protocol’s market size on Arbitrum divided by the incentives provided, measured in dollars.
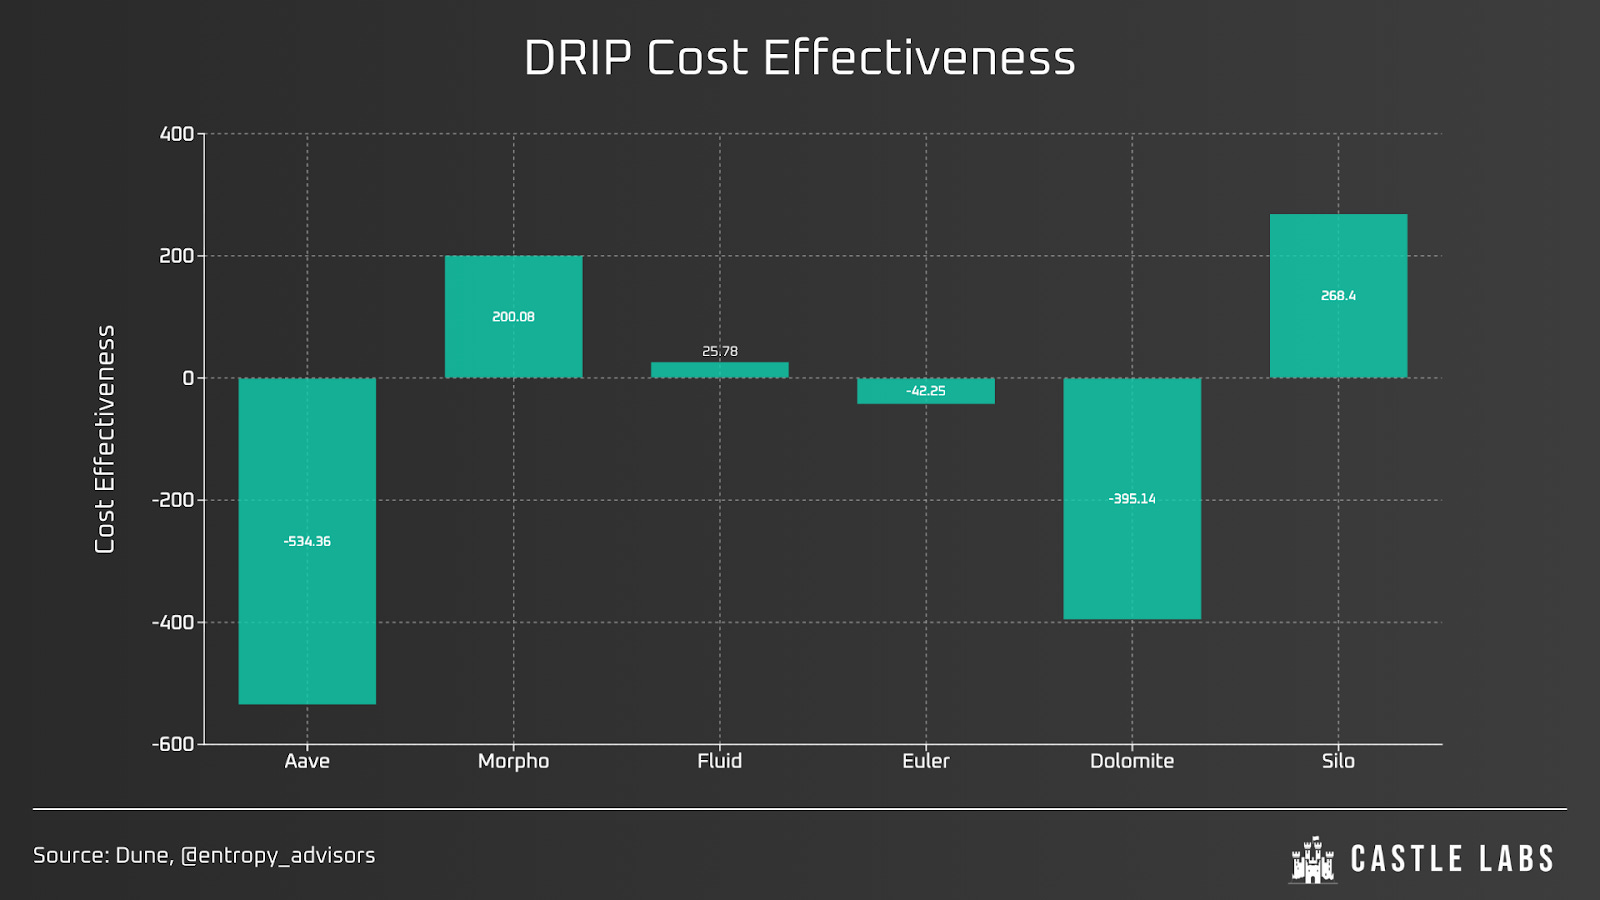
In this case, Aave, Dolomite, and Euler have negative values, whereas all the others show positive growth. For Aave, incentives were paused between epochs 2 and 5 due to ETH’s high cost of capital, as its supply on the chain declined under parallel incentive programs on chains such as Plasma and Linea. Due to the incentive pause, the burden of cost-effectiveness shifted to later epochs for Aave, which also underperformed due to broader market drawdowns (Aave TVL on Arbitrum is largely skewed toward LSTs and LRTs), and not onboarding assets such as USDai and sUSDai, until recently.
Dolomite has lost 55% of its TVL on Arbitrum since the program’s start, as the protocol’s TVL is heavily concentrated in volatile, yield-bearing assets that declined in value when ETH prices fell. Moreover, Dolomite had fewer competitive integrations with incentivised and high-growth assets such as syrupUSDC and PT tokens.
For Euler, although the decline is not large, it is driven by market drawdowns and the expiration of Pendle’s PT assets, such as PT-USDai/PT-sUSDai in November, which accounted for the majority of the decline.
For protocols such as Morpho, Silo, and Fluid, conditions were similar, but they benefited from specific Arbitrum launches, an incentive and focus skew toward stable assets, and performance-based rewards.
The increase in the Morpho market size was primarily driven by stablecoin inflows, including thBILL and syrupUSDC. Additionally, Morpho borrow-side growth in USDC loans and PT assets as collateral enabled effective leverage looping. Silo achieved positive campaign growth by targeting high-demand, incentivised assets such as rsETH and Ethereal vaults. For Fluid, growth was driven by deposits of syrupUSDC and USDC/USDT0 loans.
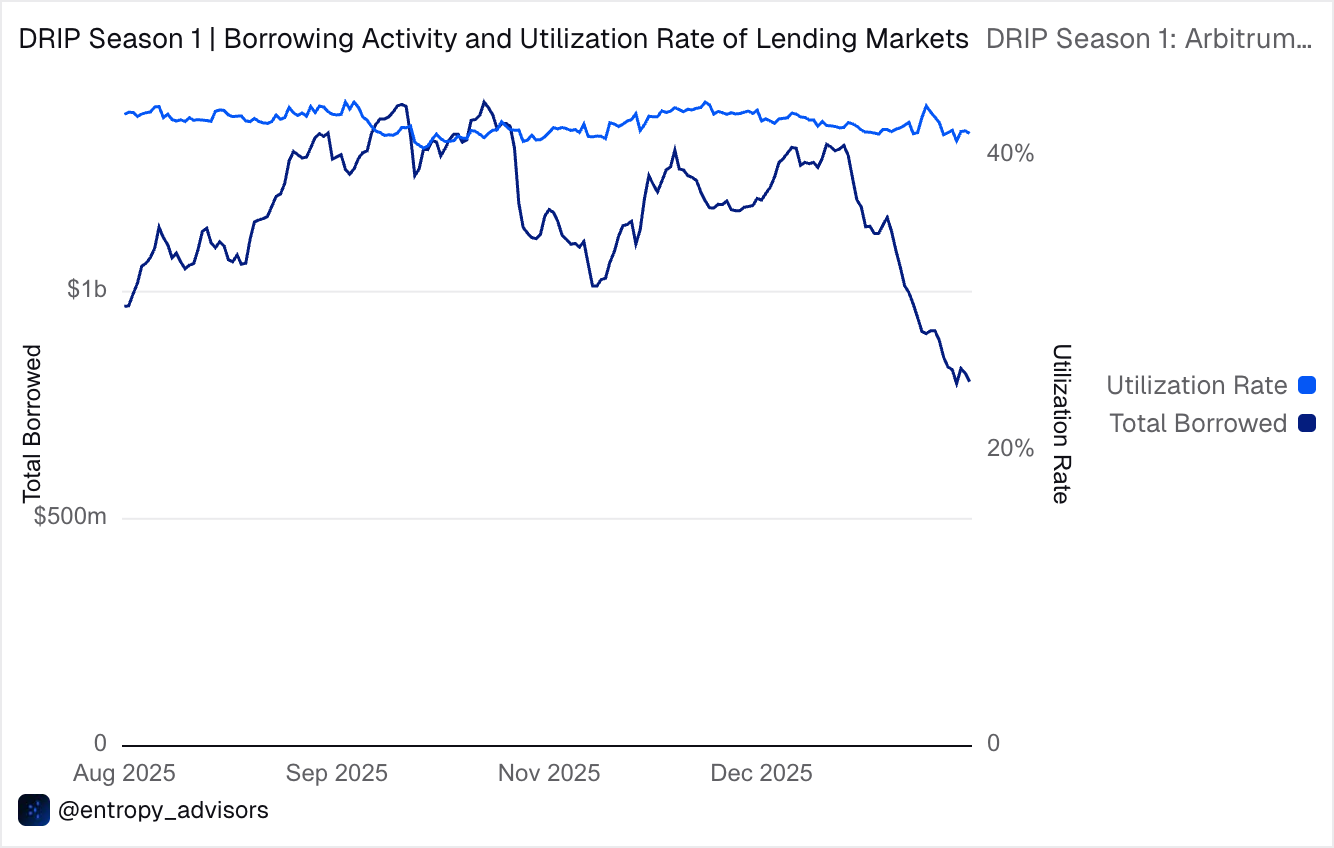
Moreover, the utilisation rate across lending markets remained stable throughout the campaign at approximately 40%, while borrowing activity fluctuated due to a combination of market conditions and incentives.
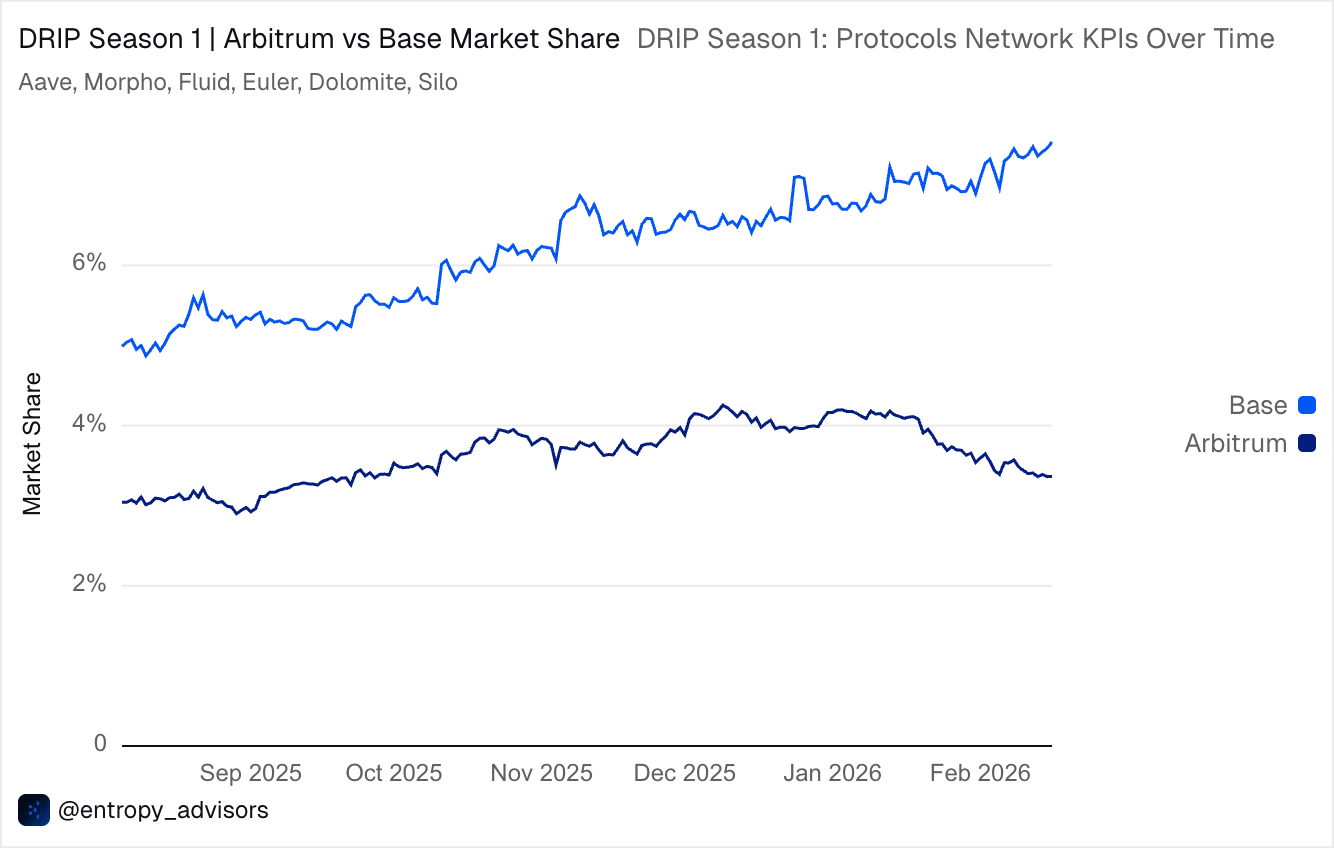
Upon comparing Arbitrum with Base in terms of the change in participating-protocol market size, we observe a clear difference and note that Arbitrum underperformed despite the campaign. Growth on Base is primarily driven by Morpho and Aave (cumulatively represent 95% of Base lending TVL) through their partnerships with exchanges and wallets, including Coinbase and Bitget Wallet.
After reflecting on the overall growth of lending markets on Arbitrum, we examine how each incentivised protocol performed.
Aave
Among the incentivised protocols, Aave received ~34% of all rewards ($1.47 million), given its size and larger user base. This aligns with the campaign structure for rewarding winning protocols and assets.
In certain initial epochs, Aave’s incentives were paused and reserved for subsequent epochs (after the 5th epoch). When incentives were introduced for Aave, its WETH market size increased by 76k units; ETH and related assets saw more than $160 million in net inflows; and rsETH grew to $283 million. This corresponds to an increase in market size in November, as shown in the chart below.
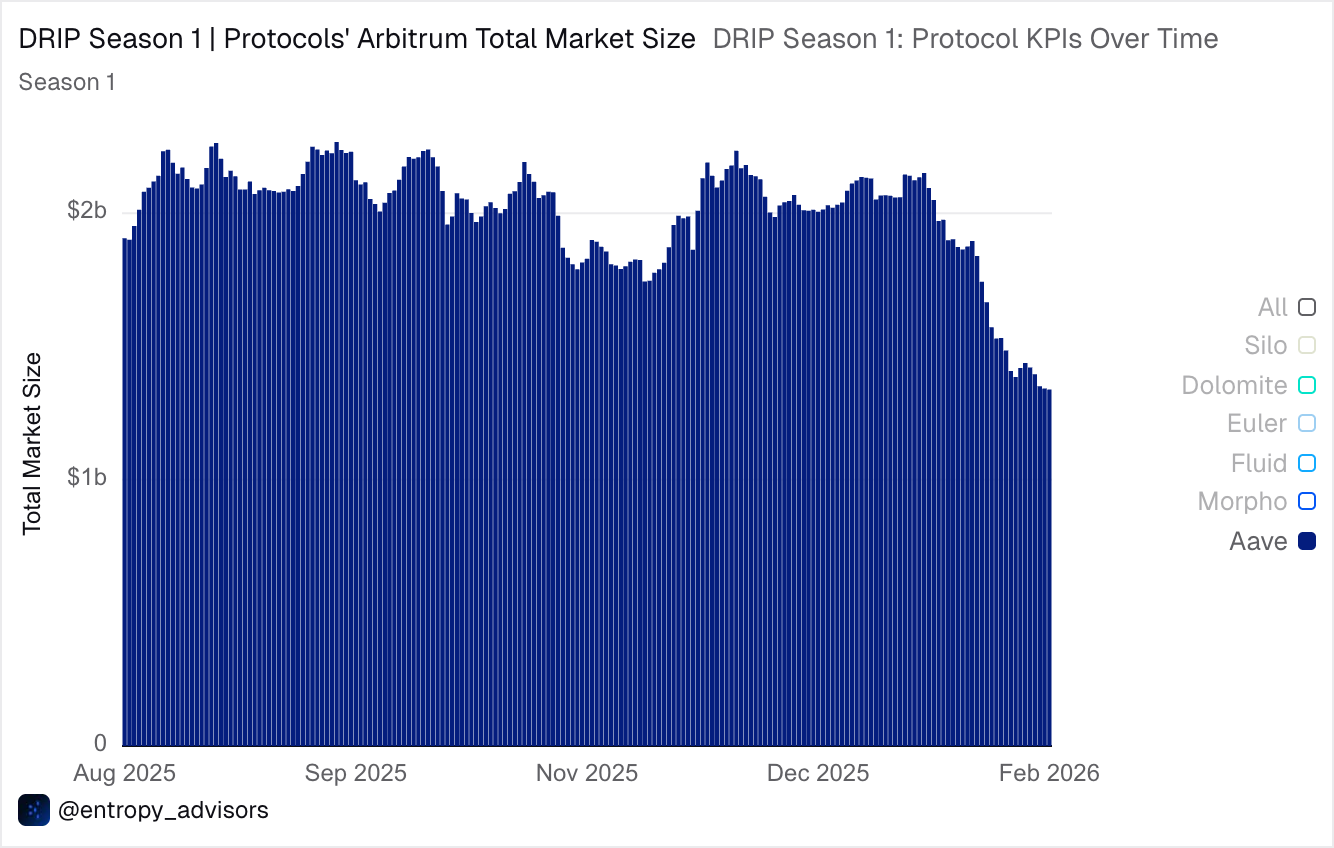
Notably, the protocol’s market size and borrowed liquidity declined significantly recently, owing to the ETH price’s decline over the past month. Its market size declined by 37%, from $2.14 billion to $1.34 billion during this period.
Morpho
Morpho is the second-largest protocol in the lending category and, given its size, was awarded the highest rewards, only behind Aave, representing ~27% of total rewards ($1.2 million).
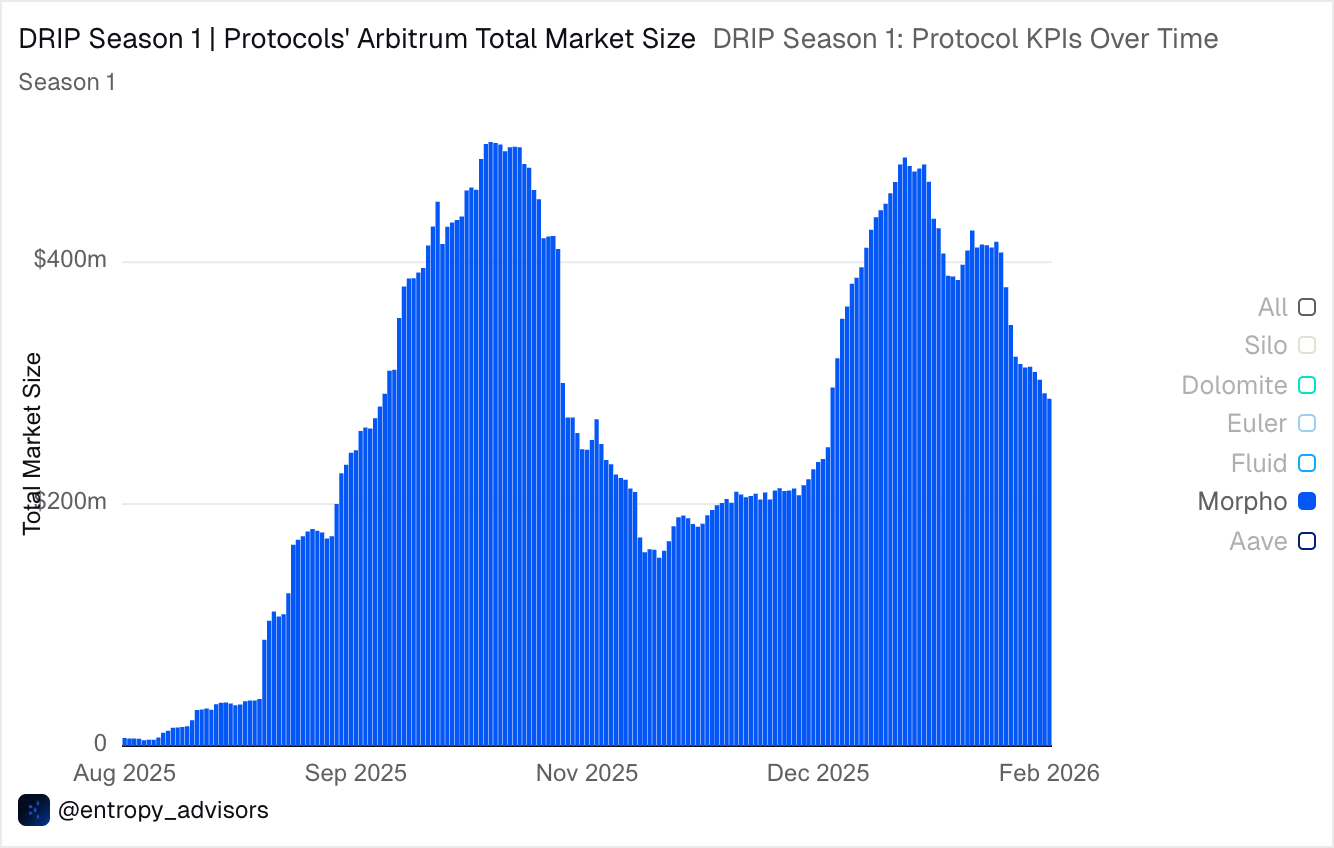
Morpho launched on Arbitrum in August 2025 and quickly reached its peak market size of approximately $500 million in October, driven by a strong focus on stable assets and competitive rates for eligible assets, such as syrupUSDC. Additionally, thBILL inflows contributed to its growth.
However, following the October Liquidation Event and the allocation of some vaults to overleveraged YBS (Stream Finance Incident), its growth was adversely affected, resulting in a 68% reduction in market size from the peak in late October. On this note, Entropy also blacklisted two vaults (MEV Capital USDC and Hyperithm USDC) from receiving DRIP rewards.
Later, Morpho recovered to similar levels in January 2026, driven by syrupUSDC and PT-USDai markets, only to experience a recent downtrend, a pattern consistent with that observed in the other protocols.
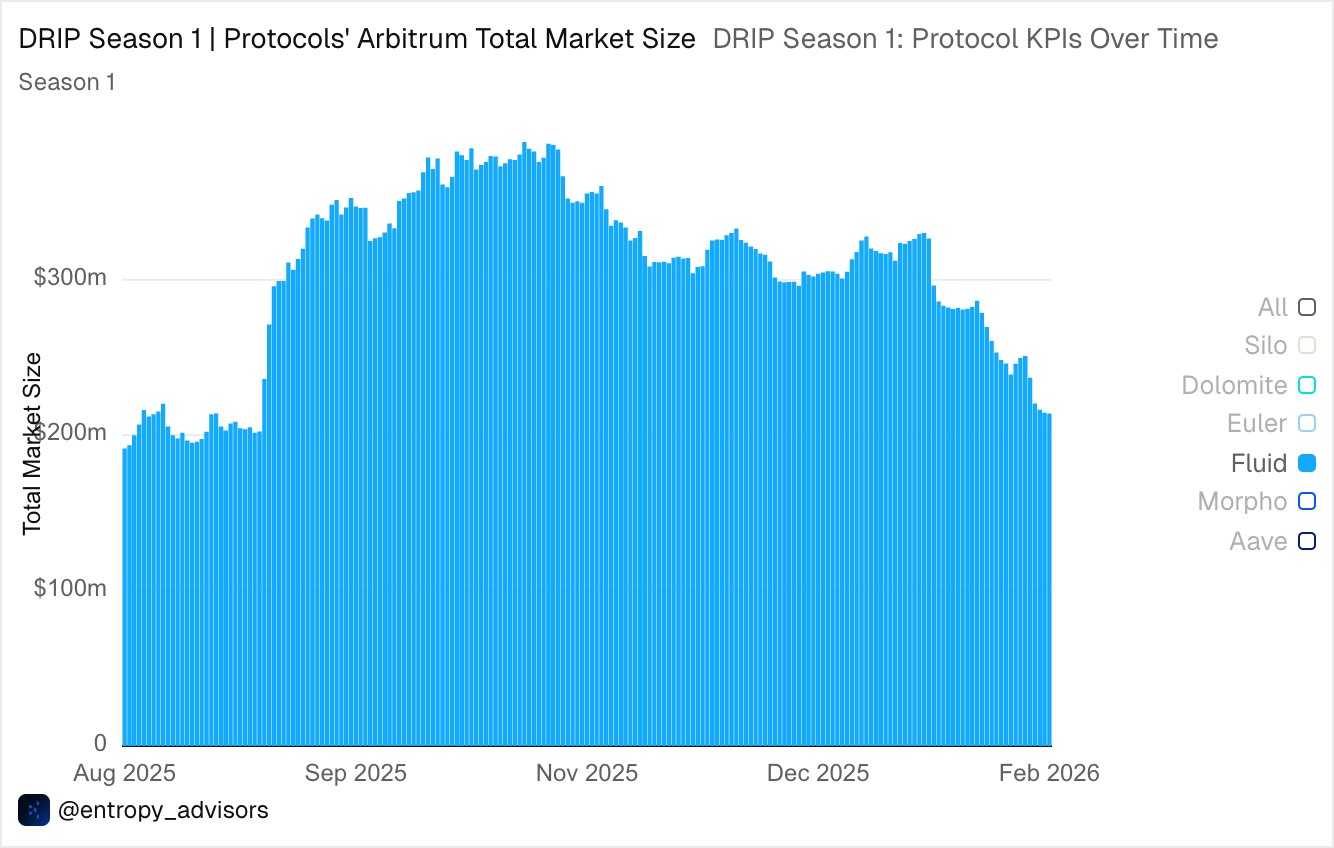
Fluid
Fluid accounted for ~19% of the net incentive allocation ($850k).
Fluid’s market size increased during the initial phase of the incentive period, rising by 63% from the start of the campaign, driven by syrupUSDC deposits, and then declined after peaking in early November.
Similar to Aave and Morpho, Fluid also experienced a 35% decline in its market size over the past month, falling from $330 million to $213 million due to market drawdown.
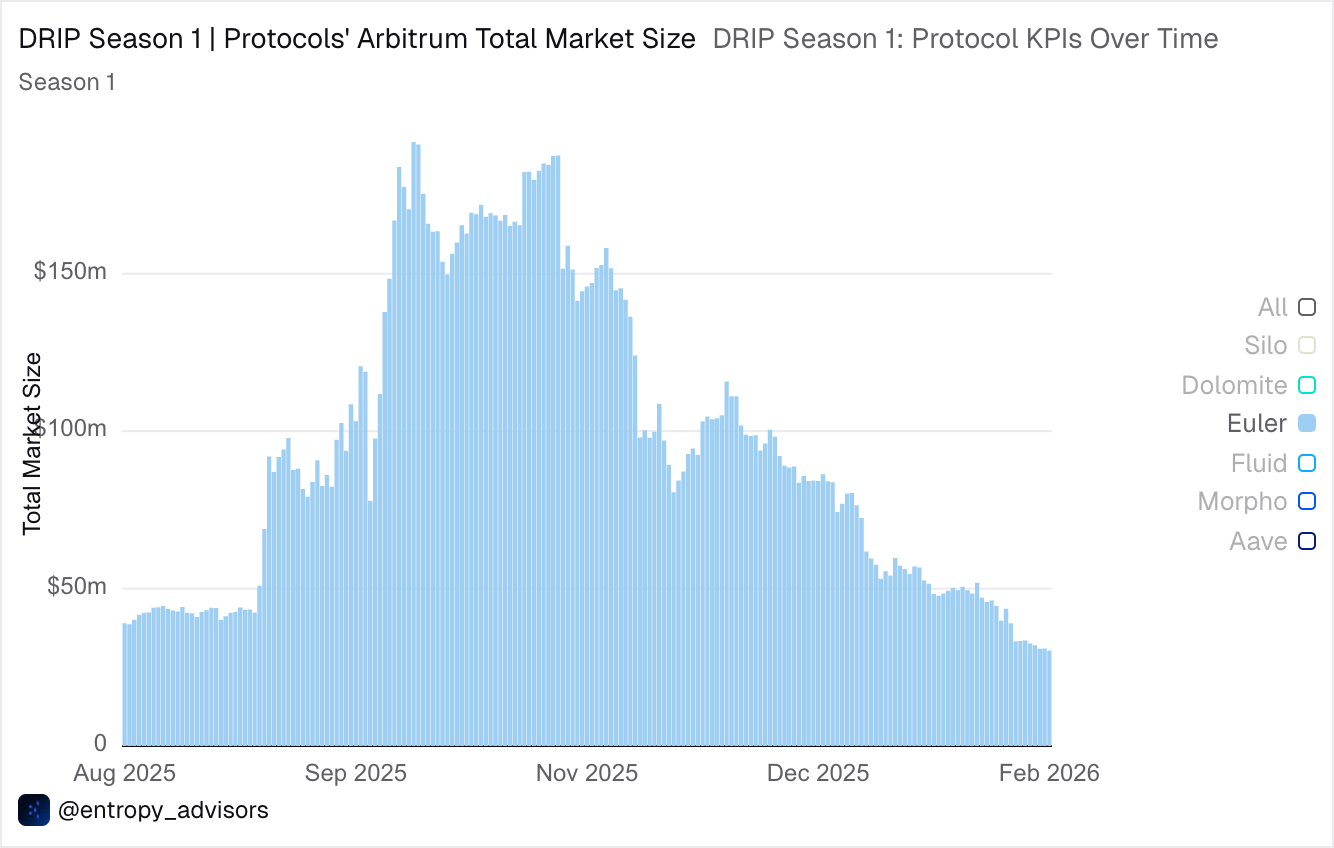
Euler
Euler was allocated 13% of the net incentives, worth $580k.
Euler has a story similar to Morpho; it launched on Arbitrum last year and employs a curator model similar to Morpho’s. Its market size declined following the Stream Finance Incident and the expiration of PT assets around the same time (though it didn’t witness any bad debt, so no rewards were reduced as Morpho).
Its market size has not recovered on the chain since then and is currently down ~85% from the campaign peak of $190 million to $30 million.
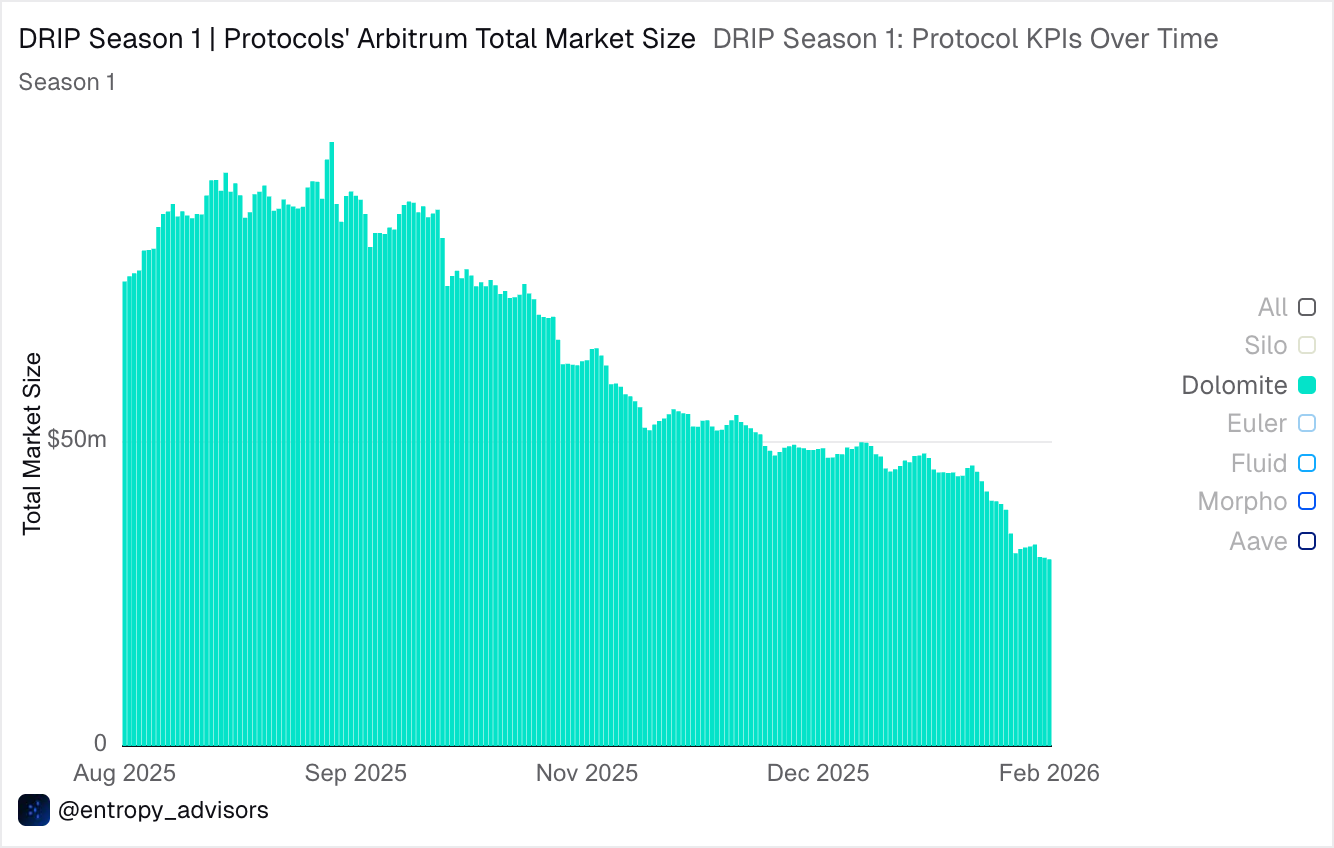
Dolomite
It was awarded ~3.5% of the total rewards distributed across the campaign ($150k), exceeding Silo’s share.
The Dolomite story differs slightly from the aforementioned protocols; it began the campaign with an estimated market size of approximately $92 million and currently stands at $30 million, a 68% decline, attributable to a higher proportion of yield-bearing assets and less emphasis on high-growth assets such as syrupUSDC and PT assets.
Their downward trend correlates with market conditions and was not benefited by incentives.
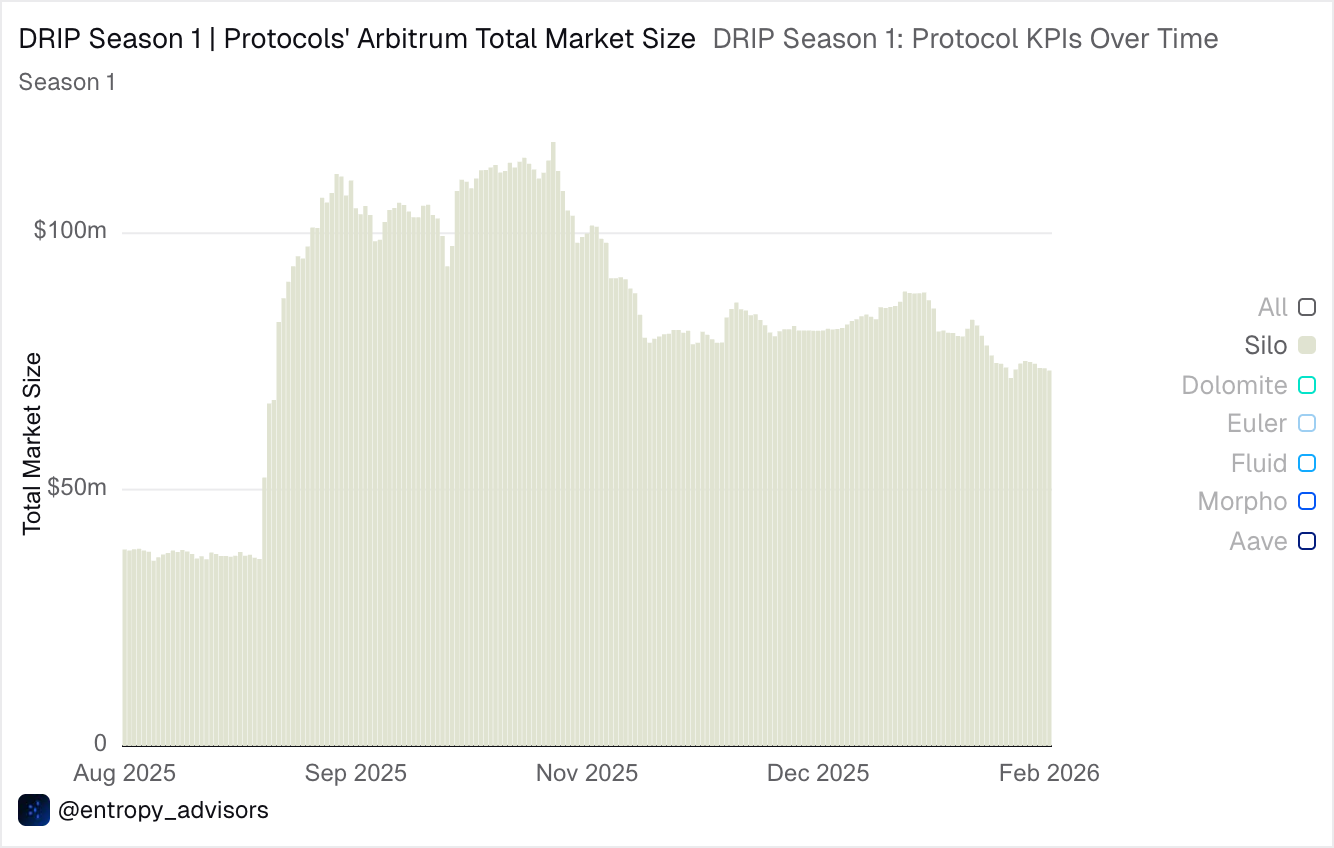
Silo
Silo received ~3% of the net incentives ($136k) and still grew at a decent pace.
Silo is one of the protocols that closed the campaign with net-positive growth and entered the program with a market size of $50 million, which has since grown to $73 million.
They reached their peak in early November but declined following exposure to the Stream Finance Incident, leading to Entropy removing the rewards for certain exposed vaults like Varlamore USDC and Silo TID vault.
Overall, they performed better with respect to the program’s cost-effectiveness due to a focus on Optima USDC and Ethereal vault and assets such as rsETH, which were incentivised.
ETH Assets
LSTs and LRTs were also incentivised during the campaign, although they accounted for only ~37% of the net incentives distributed, compared with the YBS, which received the remainder. These assets were selected because they are yield-bearing and can be used to perform activities such as looping.
Recall that, as noted above, for a looping strategy to be successful, the platform’s borrowing rate must be lower than the asset’s yield.
Hence, the incentives are targeted to:
Reduce the effective borrowing rate.
Increase the yield on depositing these assets as collateral.
Hence, looping becomes more profitable. Few assets were eligible for rewards during the season: wstETH, weETH, ezETH, rsETH, and gmETH.
The market capitalisation of these assets grew rapidly, reaching a peak of $1.22 billion in mid-September last year, and has since declined to approximately $600 million. Moreover, in ETH terms, the market capitalisation has grown by ~22% since the start of the campaign, increasing from 249k to 302k ETH. The decline in the USD-denominated market cap can be attributed to falling ETH prices, but an increase in ETH terms indicates net inflows, suggesting that incentives worked for these assets.
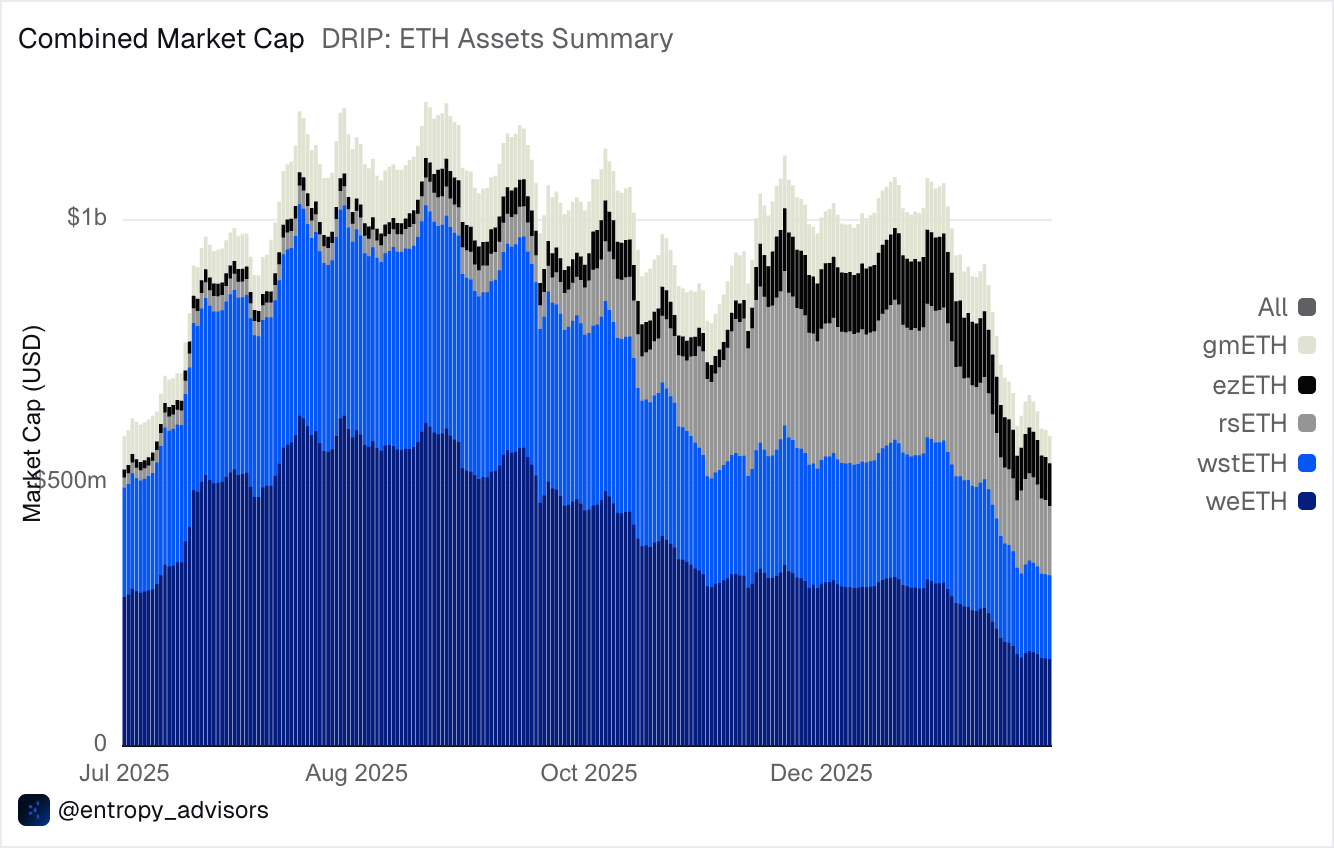
While market capitalisation shows the asset supply on the chain, its utilisation can be analysed by the increasing market size in lending protocols, the specific area where the campaign focused.
Two outliers, Kelp (rsETH) and Renzo (ezETH), grew by ~380% (from $28 million to $137 million) and ~2784% (from $2.6 million to $75 million), respectively. Notably, their size on Arbitrum at the start of the campaign wasn’t large relative to other incentivised assets, such as weETH and wstETH, but they ended up with a market size comparable to theirs.
The lower maturity of these assets in the initial phases of the campaign enabled them to grow on Arbitrum, driven by competitive yields from issuer rewards. When incentives were restored to LSTs and LRTs on Aave in Epoch 6, their growth accelerated exponentially.
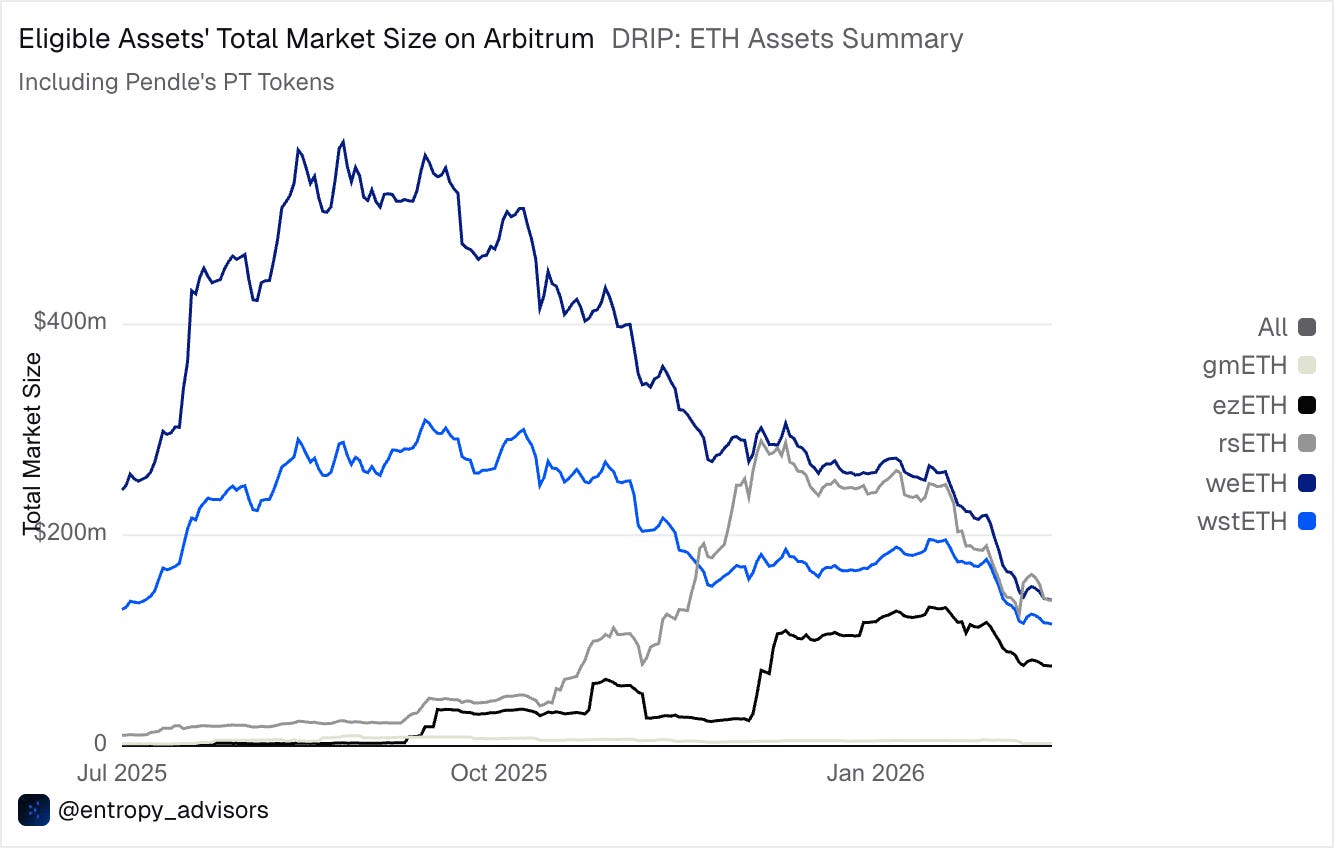
Additionally, during the campaign, the dominance of these assets on Arbitrum increased, particularly for rsETH (Kelp) and ezETH (Renzo), rising from ~2% at program start to ~12% and ~19%, respectively.
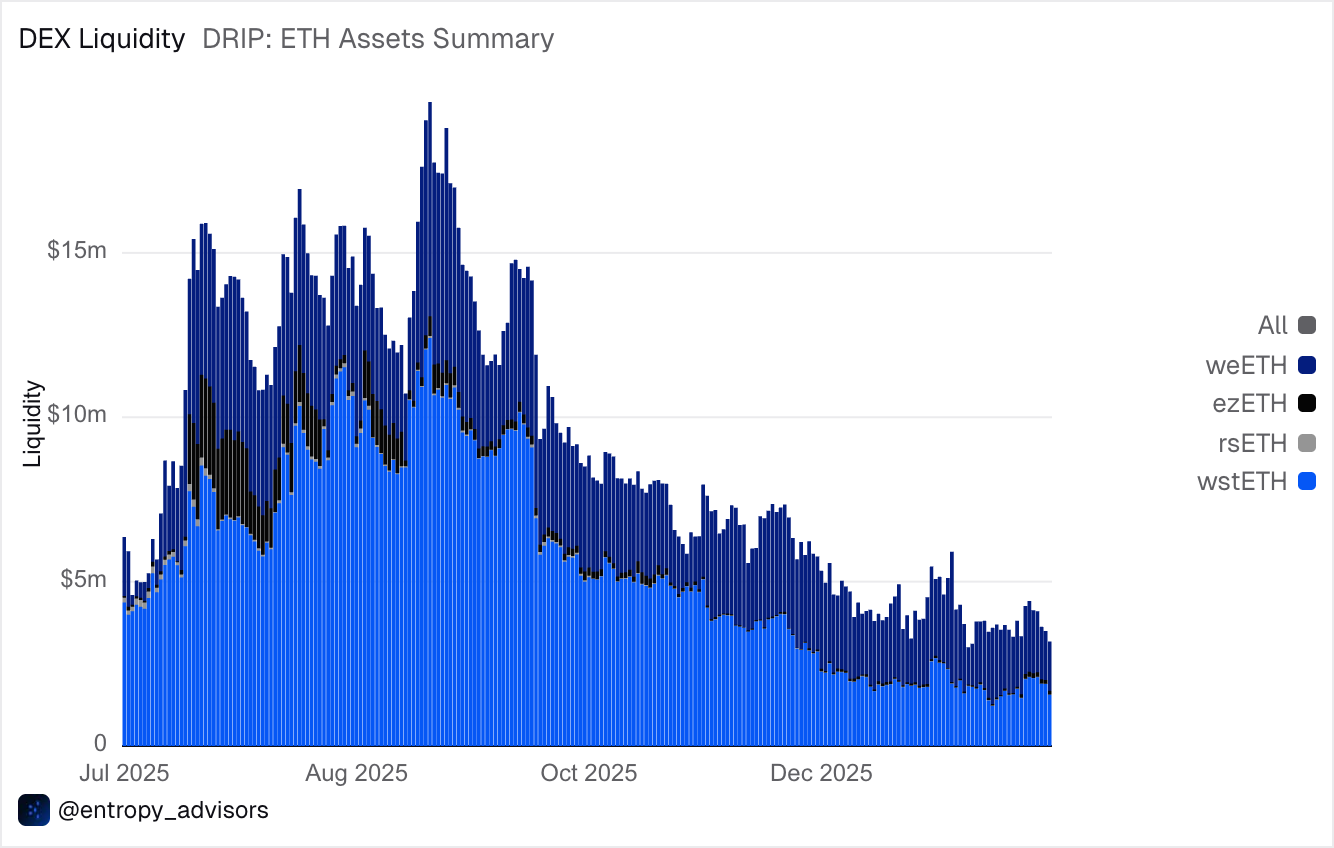
Reviewing the net market size and asset capitalisation of the incentivised ETH-related assets, it’s relatively down from its peak and has been decreasing due to lower ETH prices. This also directly affected the DEX liquidity of these assets, which has decreased compared to the start of the campaign.
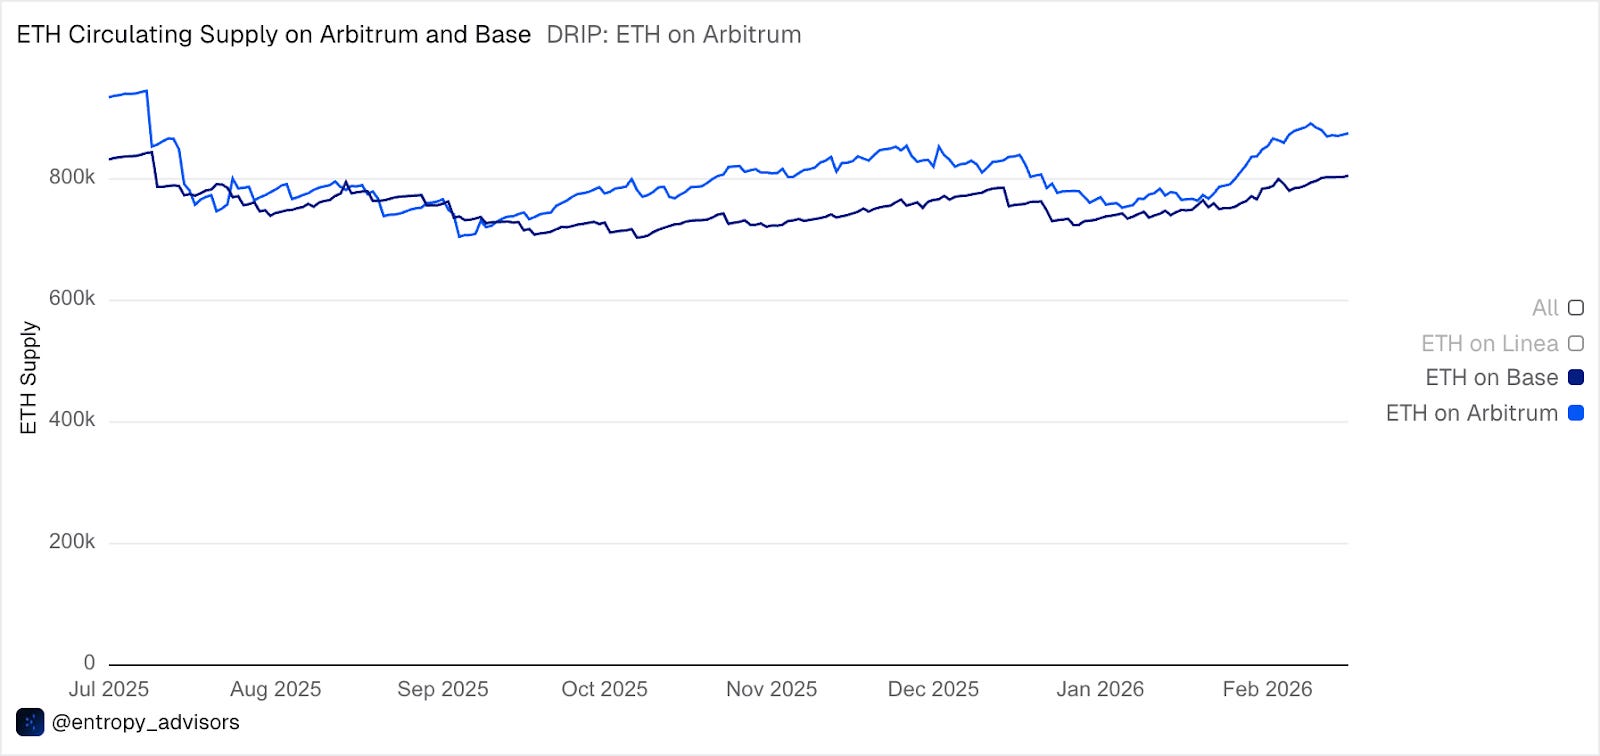
Compared with the ETH supply on Base, the Arbitrum ETH supply changed noticeably; Arbitrum led and grew by 18% during the campaign period, while for Base, it is 9%. The current ETH supply on Arbitrum sits at 872k.
USD Assets
On the other end of the incentive spectrum, YBS (yield-bearing stablecoins) were incentivised. They represent 63% of the net incentives distributed, far more than ETH-related assets. Since these assets are yield-generating, they can be used for looping strategies. During the campaign, multiple assets were incentivised, including sUSDC, sUSDS, USDe, USDC, sUSDe, RLP, wstUSR, sUSDai, syrupUSDC, and thBILL.
Compared with the growth of other aspects of DRIP, YBS performed very well. From the start of the campaign, the combined market capitalisation of these assets increased by ~45% from $923 million to $1.33 billion. One of the key contributing factors for this increase is the launch of USDai on Arbitrum last year.
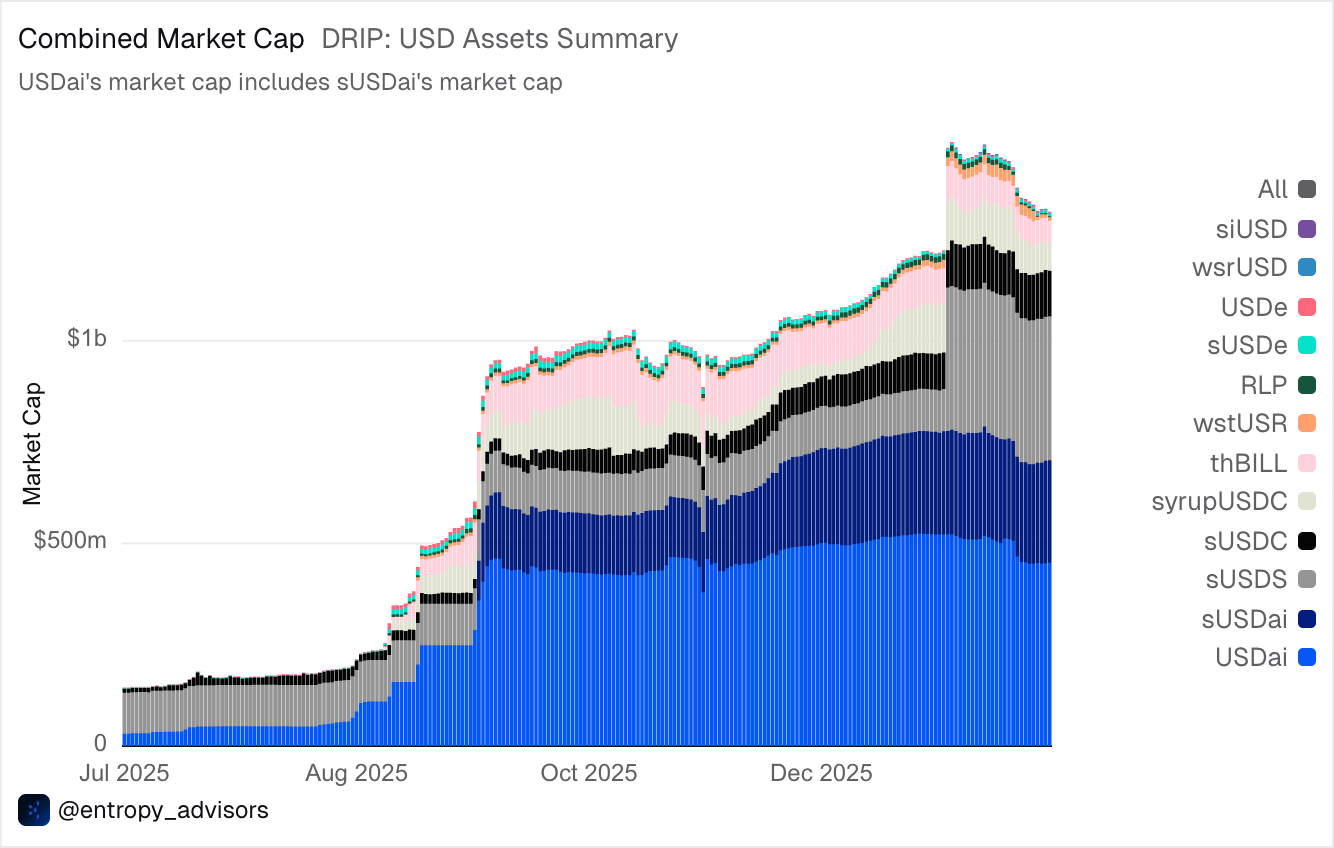
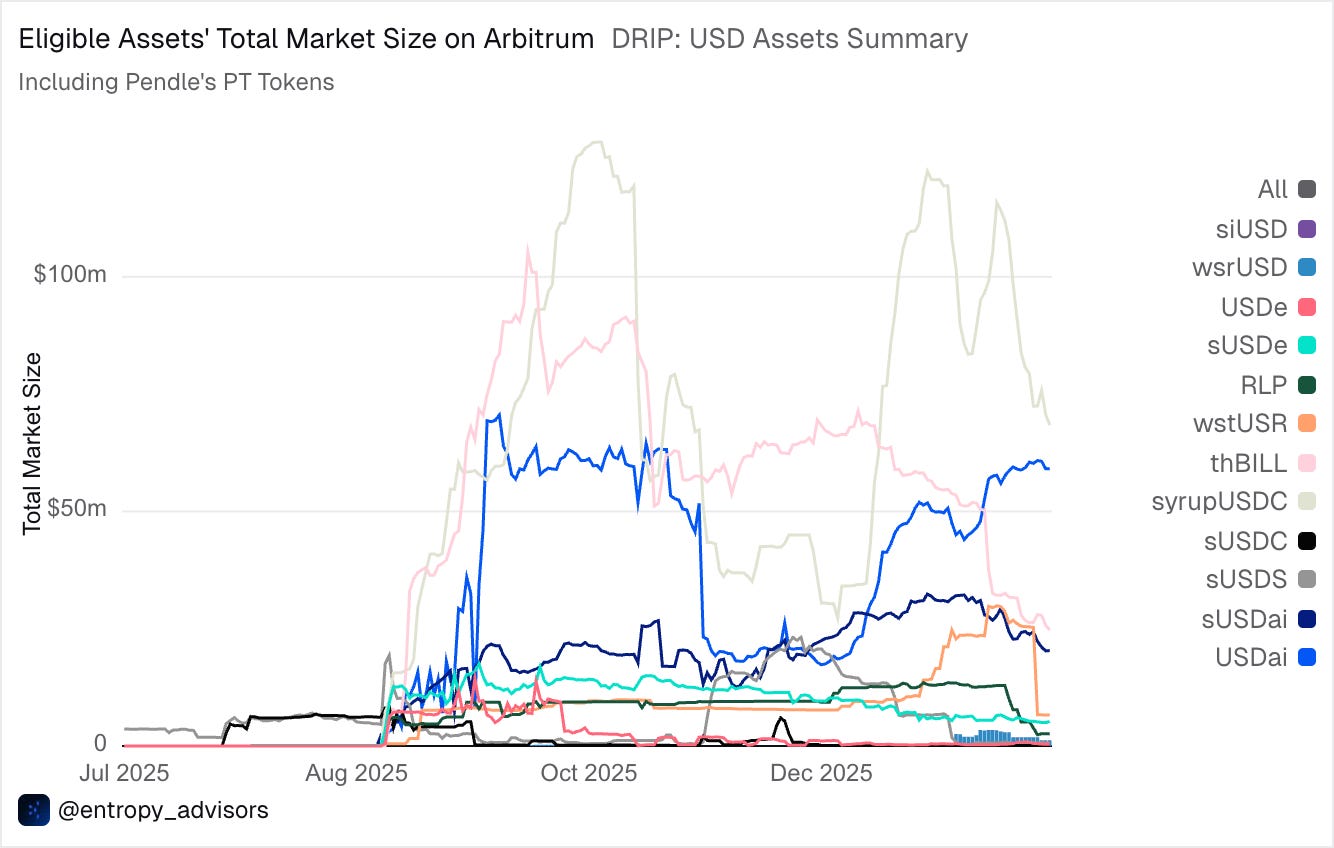
Moreover, their total market size on Arbitrum has increased from $43 million to $190 million, a 340% increase. This is a positive change, but it remains substantially below the asset market size peak in late October, which was $330 million, due to the October Liquidation Event and the requirement to unwind positions.
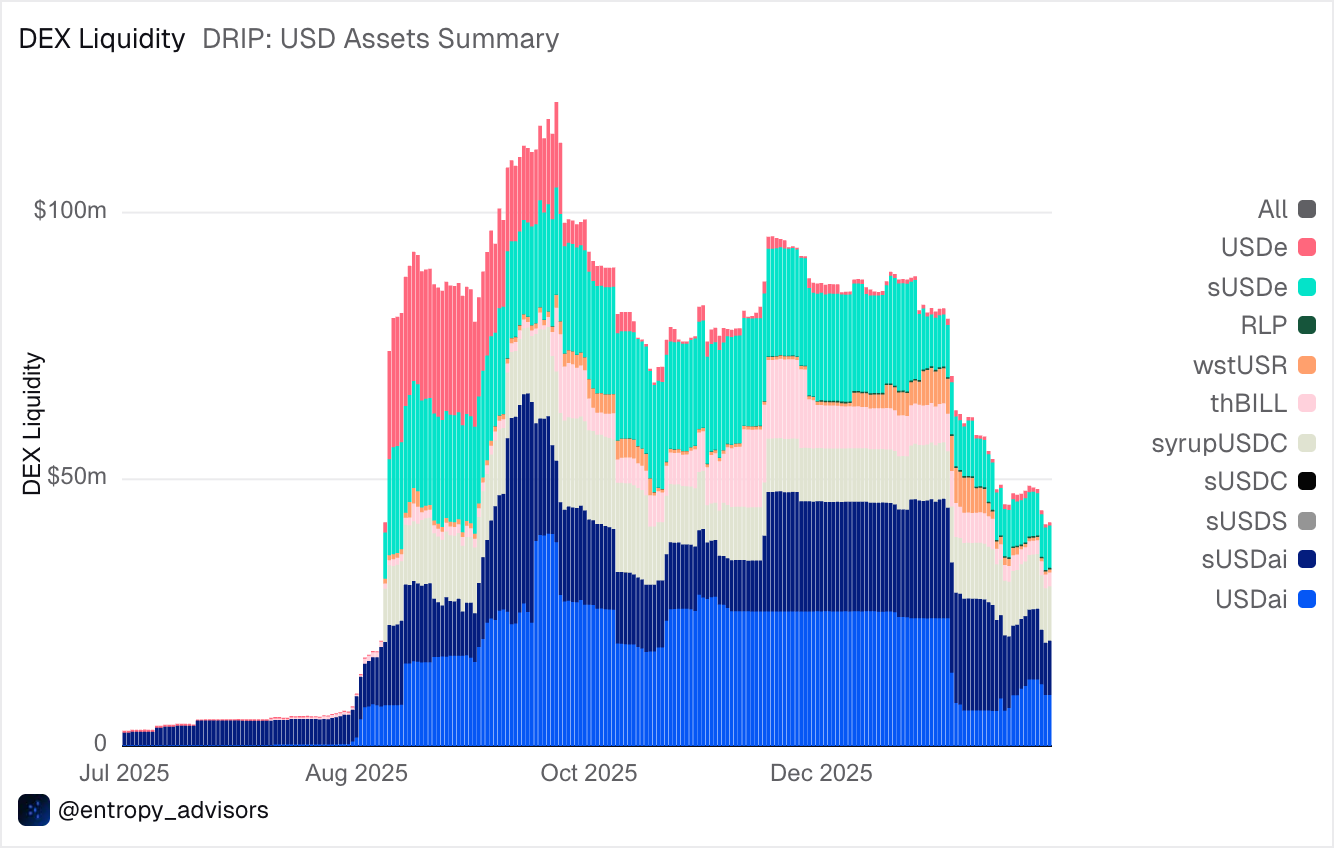
A similar rationale applies to the DEX Liquidity of these assets on the chain, which has declined by 65% from its peak of $120 million in mid-October to $41 million. Additionally, following the market downturn, DEX liquidity for YBS on Arbitrum has also declined.
Closing Thoughts
DRIP seeks to address the incentive structure and mercenary capital problem of incentive programs across its four seasons. The first season has officially ended with the distribution of 16.7 million ARB tokens (~$4.3 million). The program aimed to incentivise the winning protocols and assets through activities that had second-order effects, such as looping.
The focus of Season 1 was on YBS, LSTs and LRTs. As ETH assets are inherently volatile, incentives were unable to provide much support during the drawdown, but they did provide some support for certain protocols. For YBS, growth appeared positive, but the broader market drawdown also contributed to a reduction in market size on lending protocols. Overall, more incentives for YBS led to net positive growth in the market capitalisation of these assets on Arbitrum.
The data indicate that additional incentives don’t always yield the greatest growth, as the cost-effectiveness of certain protocols, such as Silo, is higher than that of others, even though they received the fewest incentives. Although it is fair to say that Silo size isn’t large, it had more space to grow.
Nonetheless, this was only the initial season of the DRIP campaign, which spanned across five months and followed a defined structure to incentivise users and to select winning assets and protocols. This case study showed that incentives can serve as a useful fallback during market drawdowns and help protocols and ecosystems sustain value for a longer period as the ETH supply on the chain grew during the program. It is also noted that active adjustments to incentives appeared effective and helped better align incentives during market drawdowns and incidents such as the Stream Finance Collapse.
That said, there are three more seasons remaining, each targeting a particular area, and there is substantial value for the Arbitrum Ecosystem to acquire, as Arbitrum currently represents only 2.18% of the total DeFi TVL. Additionally, over the past year, the ecosystem has focused on creating long-term economic value for the DAO and the ecosystem to sustain a healthy flywheel, driving constant growth.
To more ecosystem-focused initiatives, Arbitrum Everywhere.
written by @noveleader ✍️
Data used in the report can be found in the Entropy dashboards here.
Every week for the last 3 years, we have shared our research for free, directly in your email. Not a subscriber yet? Let’s fix it:

If you are more of a Telegram guy, you can read all of our research without the noise on our TG channel:
Disclaimer: This article was produced in collaboration with Arbitrum DAO. Castle Labs applies the same standard to sponsored content as in our independent research. We strive to be accurate, unbiased, and educational. Commissioned partnerships provide resourcing and distribution, not editorial control.
 | A guest post by
|